Satellite temperature, chlorophyll, and depth for albacore anglers off Washington, Oregon, and Northern California.
It’s a free map for albacore anglers fishing off Washington, Oregon, and Northern California. You can check satellite sea surface temperature, chlorophyll, and ocean depth on the same map instead of jumping between several charts.
I built it because I'm a PNW tuna angler too. I wanted a map that worked the way I actually fish: find the right temperature, look for an edge, check the structure underneath, and mark a few places worth a closer look.
The map is free to use. If it earns a place in your trip planning, you can chip in to help cover satellite data, servers, and the work of keeping it running.
See the warm and cool water, then narrow the colors to make subtle temperature breaks easier to spot.
Compare the latest combined view, individual satellite passes, and multi-day views. Each one tells a slightly different part of the story.
Put depth and seafloor shape under the satellite layers to see where a break crosses the shelf, a canyon, or other structure.
Check mapped rock, sand, mud, and gravel where coverage is available, especially if bottom fishing is part of the day.
Save pins and color settings so you don't have to rebuild your map every time you start planning a trip.
Use it in a browser on your phone, tablet, or computer. You can also add it to your home screen like an app.
Open the map and create a free account if it's your first visit. Your account keeps saved spots and presets available the next time you come back.
Start with SST or chlorophyll and check the dates available. Satellite images can be delayed or partly blocked by clouds, so the newest image isn't always the most useful one.
Narrow the color range until the changes you care about stand out. Save the setup when you find one you like.
Right-click on a computer or long-press on a phone to drop a pin. Add a name or note and it'll be waiting on your next visit.
You don't need to be an oceanographer. Here's what I look for.
This is the temperature at the ocean's surface. I use it to find water in the range I'm interested in, then look for places where that temperature changes over a short distance.
Those breaks show up as color changes. Tightening the color range can reveal a weak break that disappears when the scale is too broad. Satellite temperature is a planning tool, though, not a promise that fish will be there.
Chlorophyll gives you a rough picture of where greener, more productive water meets cleaner blue water. The combined and multi-day views pull observations together to cover more ground.
They're useful for the big picture, but remember that different parts of the image may have been observed at different times. Always check the date and age information shown on the map.
An individual pass shows what one satellite saw at one time. Clouds leave holes, but a clear pass can show sharper edges and small features that get softened in a broader view.
Don't skip an older pass just because a newer one exists. If yesterday was clearer, it may give you a much better look at the water you're considering.
The depth layer shows the shape of the bottom: the continental shelf, canyons, ridges, and the drop into deep water.
I like to compare that structure with temperature and chlorophyll. When an edge lines up with interesting bottom, it gives me another reason to take a closer look. It's one clue among many, not a guarantee.
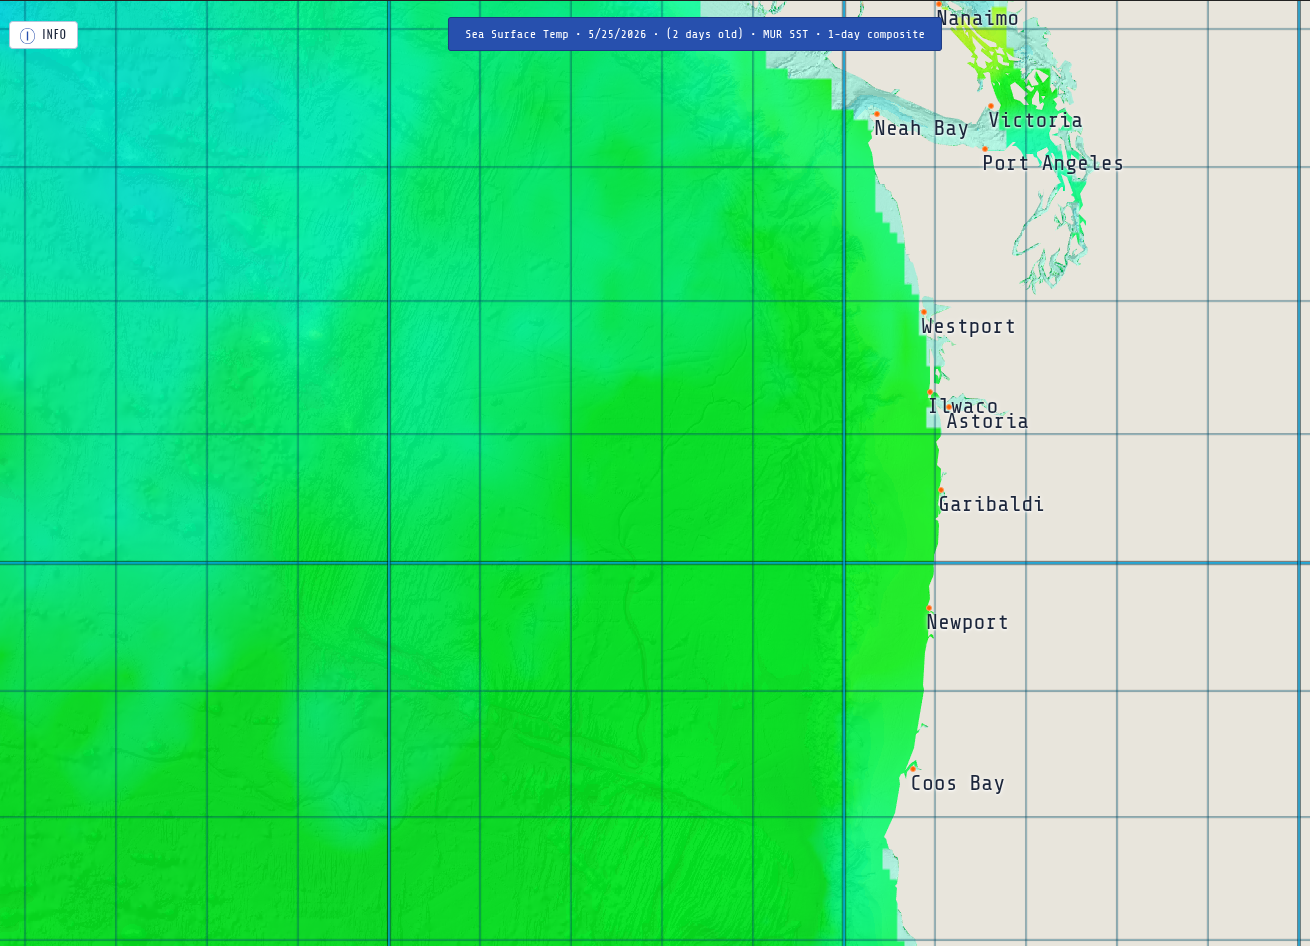 SCREENSHOT 1: SST overlay with temperature break visible, showing color range sliders
 SCREENSHOT 2: Chlorophyll overlay showing a sharp edge / front
 SCREENSHOT 3: SST + Depth contours overlaid, showing structure under a temp break
 SCREENSHOT 4: Mobile view with saved spots / pins visible
 SCREENSHOT 5: Split view or both-visible mode (Chloro + SST together)
 SCREENSHOT 6: Mobile install / PWA home screen icon
The map is free, and I want to keep it that way. If you find it useful, a contribution helps pay for satellite data, servers, and the time it takes to maintain and improve the site.
No pressure. Open the map, use it, and have a good trip.